Analyzing Stocks With NGrams
December 28, 2018Trying to model the stock market involves a lot of interesting problems. Beyond just being interesting, it's also potentially profitable. If you could perfectly predict how the prices will change each day you could make a lot of money.
I've been learning Golang recently and trying to come up suitable personal projects to use it for. Stock analysis seemed like a good candidate. It will involve a lot of networking to fetch stock data. Performance is also important because I would need to run computationally expensive algorithms on very large sets of data.
The goal is an automated system which downloads weekly stock information and makes predictions about how the prices will move in the following week. Over the weekend the program would download all the prices from the previous week, run models on the new data, and output these predictions. The stock which is predicted to have the highest percent increase would be the best to invest in. I could buy the predicted stock on Monday, and hold it until Friday that week. If the prediction was accurate the price should have gone up and I will make money when I sell it on Friday.
I also want to say that stock analysis is a hard problem. I don't seriously expect to get any useful results from my work on this. It would be foolish to invest any real money with the predictions these kind of models make. I'm doing it because it's fun and interesting.
Also there's some code in this article. I've omitted some details and error handling to shorten the snippets included here. You can see the actual code on my GitHub.
Getting Company Data
As I said, the goal is to have a pipeline which can process stock prices on a weekly basis. There are APIs to get stock data but you need to know the tickers for the stocks (for example the ticker for Apple is "AAPL"). So we first need to know what publicly traded companies exist, and what their tickers are. If we could collect some extra information about that would be even better, it might help build the models.
Manually cataloging this data is not a good idea, there's a lot of companies! At the time of writing there are 6,316 companies listed on the US stock exchanges. This system is supposed to be automated; you shouldn't have to manually enter information for new companies. Fortunately, there is a public API for getting this sort of data for companies on the NASDAQ and NYSE exchanges. You can download a CSV that includes company name, ticker, industry, sector, and market capitalization. The URL is:
http://www.nasdaq.com/screening/companies-by-industry.aspx?render=download
So we need a program which can download this data, parse it, and ideally dump it in a database so we can access it later. First, I made a struct for a "company":
type Company struct {
    Ticker       string
    Name         string
    LastSale     float64
    MarketCap    float64
    ADR          string
    TSO          string
    IPOYear      int64
    Sector       string
    Industry     string
    SummaryQuote string
}
Since the data comes from the API as a CSV we need to parse the values in the CSV and marshal it to our Company struct. The built-in encoding/csv package can actually do this.
func parseCompaniesFromCSV(ioReader io.Reader) map[string]Company {
    companies := make(map[string]Company)

    reader := csv.NewReader(ioReader)
    reader.Comma = ','

    for {
        record, err := reader.Read()

        if err == io.EOF {
            break
        }

        ticker := strings.TrimSpace(record[0])
        marketCap, _ := strconv.ParseFloat(record[3], 64)
        // etc.

        company := Company{
            symbol,
            name,
            lastTrade,
            marketCap,
            adr, tso,
            ipoyear,
            sector,
            industry,
            summaryQuote}

        companies[symbol] = company
    }

    return companies
}
Downloading this data with Go is really simple:
url := "http://www.nasdaq.com/screening/companies-by-industry.aspx?render=download"
resp, err := http.Get(url)
body, err := ioutil.ReadAll(resp.Body)
reader := bytes.NewReader(body)
companies := parseCompaniesFromCSV(reader)
The result is a script that can be run every so often to download all the companies currently listed on the US stock exchanges. For this project I am storing the data in a Postgres database. See the "downloadCompanies.go" script in my GitHub.
With the program I wrote, you can download the company data with:
./stockAnalysis -download-companies
Getting Stock Data
Now that we have company data, we need the stock data! I said the system should handle weekly stock prices. There are not many free documented APIs for getting stock data. I am using AlphaVantage. They have a variety of APIs, including real time, daily, weekly, and monthly stock prices. They also have APIs for foreign and digital currencies. For my purposes I just want the weekly stock prices. To get all of the weekly prices for AAPL the request is:
https://www.alphavantage.co/query?
    function=TIME_SERIES_WEEKLY_ADJUSTED
    &apikey=...
    &outputsize=full
    &symbol=AAPL
Just like how I had a struct for companies, I also made a struct for weekly stock quotes:
type Quote struct {
	Ticker           string
	Date             time.Time
	Open             float64
	High             float64
	Low              float64
	Close            float64
	Volume           float64
	Dividend         float64
}
I wrote a script which loads the list of companies, and fetches the stock data for each company. The API returns the data as JSON, which can be parsed with the "encoding/json" package. The script then adds the relevant data for each quote to the Postgres database. See the "downloadWeeklyQuotes.go" script in my GitHub.
The rate limiting on the free tier of the AlphaVantage API is quite aggressive; they only allow 5 requests per minute. Since there are 6,316 companies it takes quite a long time to download all the data:
6316 / 5 = 1263.2 minutes = 21.05 hours
This is a long wait but it's okay since we only need to get new predictions once per week.
Below is a snippet of the code used for downloading the price data, with error handling omitted:
func GetWeeklyQuotes(symbol string) ([]Quote, error) {
	body, err := request("TIME_SERIES_WEEKLY_ADJUSTED", symbol, "full", 10)

	var response = new(WeeklyQuoteResponse)
	_ = json.Unmarshal(body, &response)

	var stocks []Quote

	for date, rawStock := range response.TimeSeriesWeekly {
		stock := TransformRawStock(response.MetaData.Ticker, date, rawStock)
		stocks = append(stocks, stock)
	}

	if len(stocks) == 0 {
		time.Sleep(60 * time.Second)
		return GetWeeklyQuotes(symbol)
	}

	return stocks, nil
}
With the program I wrote, you can download new stock price data with:
./stockAnalysis -download-quotes
Model Variables
So, we have the company data, and we have the stock data! We even have programs to download new company and price data each week. We can examine, slice, and combine it by querying the database.
Now the hard part: predicting the future.
We have to assume that future behaviour will be related to the past. Hopefully there is some combination of variables to look at that can be used to predict how the stock will behave in the near future. There's lots of data to look at. For each company we have:- name
- ticker
- market capitalization
- IPO year
- sector (e.g. "technology" or "finance")
- industry (e.g. "pre-packaged software" or "major banks")
- Open price
- Close price
- High price
- Low price
- Volume (number of trades in that week)
- Dividend (amount issued that week)
- Change (difference between the weekly open and close)
- Volatility (difference between the weekly high and low)
For each week for each company we have:
Two derived variables that also could be useful are:
Models could base their predictions on just a few or all of these variables. Some of them might have no predictive power while others are useful to consider.
The goal is to, given all of this information, predict the percent change for the following week for every company.
NGrams
N-grams are a simple and popular approach to analyzing text. This probably sounds quite unrelated to stock analysis, bear with me! The idea is to look at text as an overlapping sequence of "grams", or combinations of characters. It's easiest to understand with an example. Consider the text "ABBAB".
These 1-grams for this text are:
"A", "B", "B", "A", "B"
The 2-grams are:
"AB", "BB", "BA", "AB"
The 3-grams are:
"ABB", "BBA", "BAB"
It's useful to count the occurrences of each possible n-gram, this allows us to see patterns. The possible 2-grams for the above example are "AA", "AB", "BA", and "BB". The 2-gram counts for "ABBAB" are bellow.
| 2-gram | Count | Frequency |
|---|---|---|
| AA | 0 | 0% |
| AB | 2 | 50% |
| BA | 1 | 25% |
| BB | 1 | 25% |
This shows that A is always followed by B, where as B is followed by A or B equally frequently.
Stock Prices As Text
You could look at a stock's history as a series of changes: one week it goes up a few percent, the next it stays fairly constant, and than the following week it's down a little. This is a natural way to look at it because it's exactly what we're trying to predict.
Numbers are hard to work with, they're very specific. It would be hard to predict that a stock will go up by exactly 13%. It seems like it would be easier to predict "it will go up a lot" or "it won't change much". For the purposes of simplying the problem and finding patterns, I thought it would be useful to reduce stock histories to a simpler form.
Along those lines, I came up with a scheme for giving a stock a "grade" for each week.- A: the stock increased (by more than 1%)
- B: the stock did not change much (increase by less than 1%, or decreased by less than 1%)
- C: the stock decreased (by more than 1%)
Consider the Apple stock for the last few weeks.
| Week | Open | Close | Change | Grade |
|---|---|---|---|---|
| August 10 - 17 | $207.70 | $217.58 | 4.76% increase | A |
| August 17 - 24 | $218.10 | $216.16 | 0.89% decrease | B |
| August 24 - 31 | $217.65 | $227.63 | 4.67% increase | A |
So for the first week it gets it get's "A". For the second "B", and the third "A". We can represent this as the string: "ABA". What is interesting about this is that it's now a text processing problem. We can try to use ngrams and other text processing techniques to try and learn about the patterns. For example if stocks that went up a lot the previous two weeks are likely to go up the next week the ngram "AAA" should be common. If stocks that went down a lot the previous two weeks tend to level out the ngram "CCB" should be common.
Predictions With N-Gram Models
So we compute the grade text for each stock by looking at the weekly changes and assigning every week a grade. Once we have the text for every company we can count the n-grams in each. The idea is that the patterns that appeared in the past will appear in the future too. For example if "A" was usually followed by another "A" in the past, we assume it will usually be followed by "A" in the future too.
Predicting the future with n-grams is a "completion" problem, similar to autocomplete on your phone. We know the last few grades for the stock, and want to predict the next one. Ngrams can be used for this. In the example I just mentioned we know the last grade was "A". The problem of predicting the next letter is really determining which ngram is most common:- AA
- AB
- AC
If "AA" is a more common ngram than "AB" or "AC" then we consider "AA" more likely. The probabilities of each ngram can be computed using the counts for each, from the ngram table.
Suppose we had the following counts:
| 2-gram | Count | Frequency |
|---|---|---|
| AA | 2 | 50% |
| AB | 1 | 25% |
| AC | 0 | 0% |
| BA | 1 | 25% |
| BB | 0 | 0% |
| BC | 0 | 0% |
| CA | 0 | 0% |
| CB | 0 | 0% |
| CC | 0 | 0% |
If the last grade was "A" we only care about ngrams prefixed with "A". So we consider just these entries:
| 2-gram | Count |
|---|---|
| AA | 2 |
| AB | 1 |
| AC | 0 |
We can computer the probabilities based on the counts. Here P(B|A) denotes the probability of a B, given that the previous grade was A.
P(A|A) = 2/3 = 66%
P(B|A) = 1/3 = 33%
P(C|A) = 0/3 = 0%
We see that A is most likely, and has a 66% chance.
It should be clear how this will be used to predict stock prices. We will use the previous few grades to predict what is likely for the next one. Additional variables could also be considered.
Building Models
So we know how to make predictions with ngrams, but how do we build these ngrams? Obviously creating the model will involve getting grade string for every stock, and counting the ngrams for each.
There's a few ways to group these counts for a model. One obvious way is to add up the counts for all the ngrams to get a single model.
An alternative approach would be to group the counts based on some other variable. For example, you could have a different model for each company, industry, or sector. That is, you could add up all the ngrams for tech companies and use that model to predict tech company prices. Then, you'd have a separate model for finance companies, and so on. It is hard to see which way would be best.
Some ways to group the data include:- one model for each company
- one model for each industry
- one model for each sector
- one model for all
Another consideration is ngram length. If the ngram length is shorter, the models will be simpler, but there is also less information captured in each. Conversely, longer ngrams capture more information but could potentially over-fit the data. Excessively long histories may not yield informative models. The ngram length needs to at least be 2, in order to make any predictions.
Since it is not obvious how to tune these parameters, I decided to try all the possible combinations and see what worked best. I set up an experiment to compare these different ways to group the data. The experiment is then repeated for every way to group the data, and for an ngram length of 2, 3, 4, ..., up to 18.
Each model was trained with stock prices from the beginning of time up to January 1, 2018. To test the models, each one was used to predict the price change for the next week. The code compared the predicted change to the actual change to determine the percentage correct for each model. You can run this experiment with:
./stockAnalysis evaluate-ngram-model-params
The below graph summaries the results:
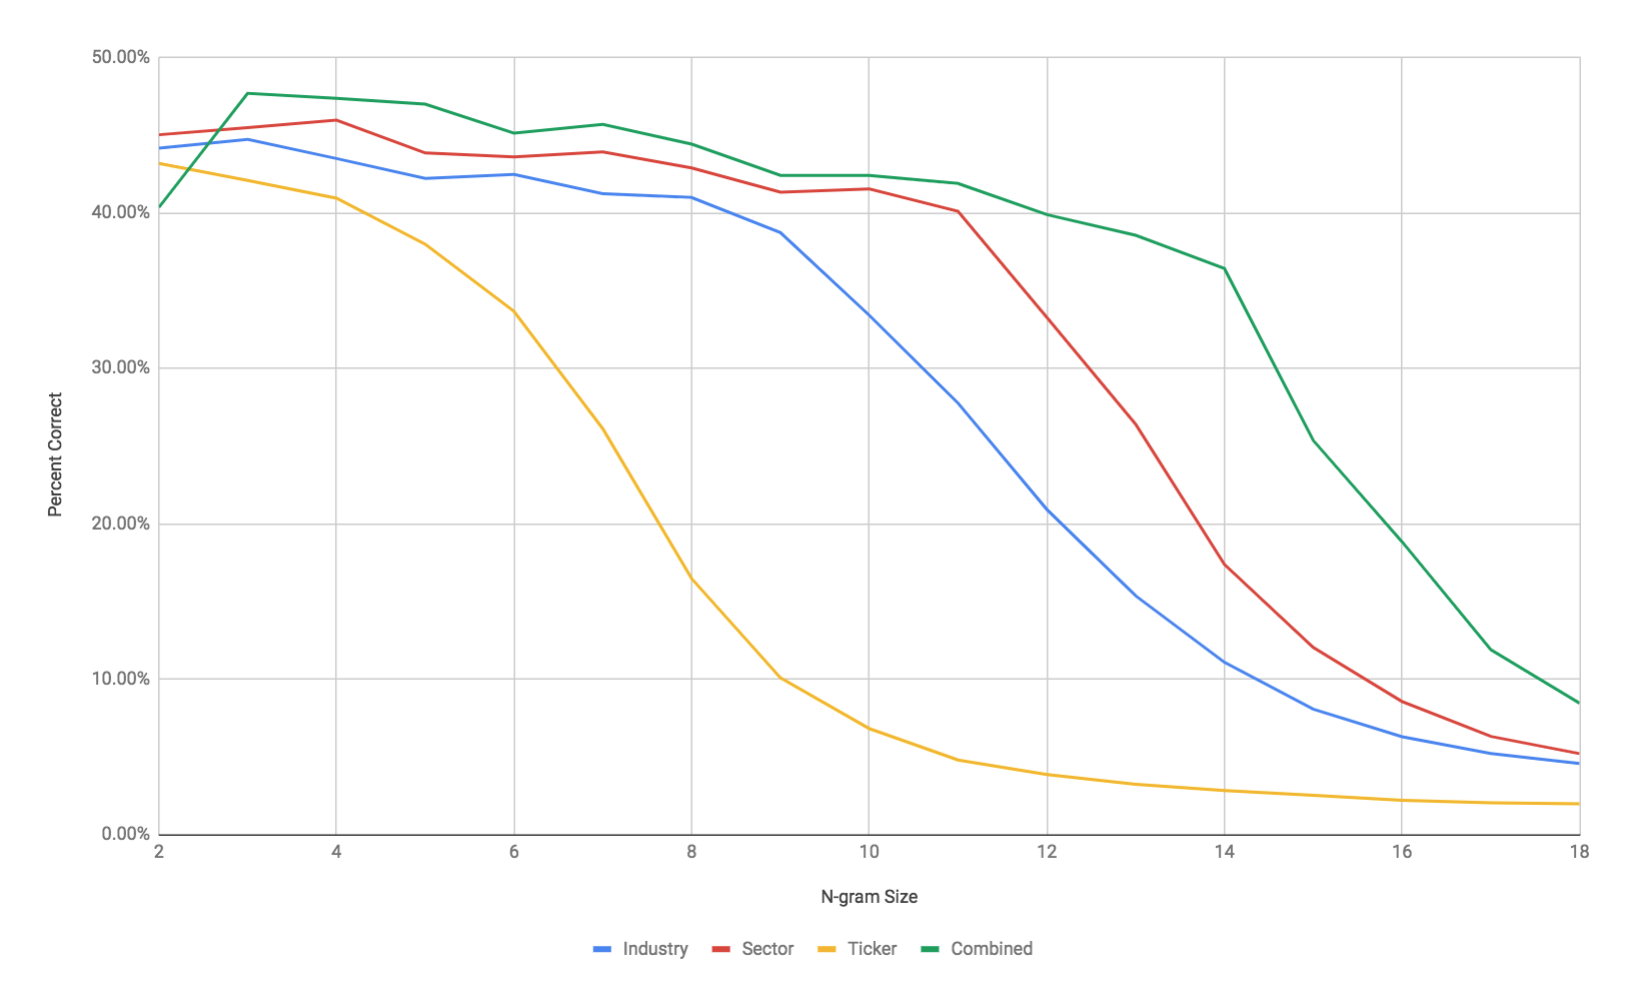
The best performance was when all of the stock price n-grams were counted together with a single model (the green line) with an n-gram length of 3. For all of the ways to group the data, n-grams between 2 and 4 characters worked best.
Resulting Model
I wrote code to get the prices for each stock, convert it to text using the scheme I just described. With my program you can run the command:
./stockAnalysis -print-ngrams
It gets the full grade text for every stock and counts all the 1-grams, 2-grams, and 3-grams. The results are below. This is based on US stock market data from January 1995 to October 2018. The following 3 tables show the results.
| 1-gram | Count | Frequency |
|---|---|---|
| C | 1102100 | 26.42% |
| B | 1510621 | 36.21% |
| A | 1559272 | 37.37% |
| 2-gram | Count | Frequency |
|---|---|---|
| BC | 314880 | 7.56% |
| CB | 325746 | 7.82% |
| CA | 351449 | 8.44% |
| AC | 362142 | 8.69% |
| CC | 423076 | 10.16% |
| BB | 575317 | 13.81% |
| AA | 588718 | 14.13% |
| AB | 607395 | 14.58% |
| BA | 616930 | 14.81% |
| 3-gram | Count | Frequency |
|---|---|---|
| CBC | 89130 | 2.14% |
| BCC | 91220 | 2.19% |
| CCB | 97430 | 2.34% |
| BBC | 102502 | 2.46% |
| CAC | 106018 | 2.55% |
| BCB | 107729 | 2.59% |
| CCA | 108067 | 2.60% |
| CBB | 110544 | 2.66% |
| ACC | 113877 | 2.74% |
| BCA | 115038 | 2.77% |
| ACB | 120160 | 2.89% |
| CAB | 121674 | 2.93% |
| ABC | 122791 | 2.95% |
| CAA | 123546 | 2.97% |
| CBA | 125098 | 3.01% |
| BAC | 127708 | 3.07% |
| ACA | 127832 | 3.07% |
| AAC | 127923 | 3.08% |
| CCC | 216916 | 5.22% |
| AAA | 227290 | 5.46% |
| BBB | 227770 | 5.48% |
| AAB | 233264 | 5.61% |
| ABB | 236091 | 5.68% |
| BAA | 237113 | 5.70% |
| BBA | 243468 | 5.85% |
| ABA | 247570 | 5.95% |
| BAB | 251544 | 6.05% |
There's some interesting patterns to notice here. Firstly, A is more common than C. That means stocks go up more often than they go down!
In the 2-gram table, consider the ngrams which are prefixed with "C":
| 2-gram | Frequency |
|---|---|
| CB | 7.82% |
| CA | 8.44% |
| CC | 10.16% |
If a stock went down one week, it's most likely that it will go down again the next week too. There's also a reasonable chance that it will go up again. A small change (B) is least likely. The probabilities are:
P(A|C) = 8.44/26.42 = 32%
P(B|C) = 7.82/26.42 = 30%
P(C|C) = 10.16/26.42 = 38%
One more example. Consider n-grams prefixed with "CB" in the 3-gram table. This is where a stock goes down significantly one week, and then does not change much the following week.
| 2-gram | Frequency |
|---|---|
| CBC | 2.14% |
| CBB | 2.66% |
| CBA | 3.01% |
The probabilities of A, B, and C given CB are:
P(A|CB) = 3.01/7.81 = 39%
P(B|CB) = 2.66/7.81 = 34%
P(C|CB) = 2.14/7.81 = 27%
We see if the last two grades were "CB", it's not likely the stock will go down more (27%). It is most likely it will increase (39%) or remain stable (34%). This is just a taste of some of the interesting patterns in the data. To be clear, these are trends from past data. It is unclear what predictive power they have.
Model Performance Over Time
We have determined that the best approach is to build a single model for all companies, with ngrams of size 3. Now we should determine how well it performs in practice.
To see how the model improves as more data is considered, I wrote code to build the model for each week, do predictions, and check if they are correct. Then we can graph over time how the model performs. Hopefully it gets better as more data is considered.
Here's a snippet of the code that does this:
func EvaluateNGramModelOverTime () {
	maxN := 3
	splitDate := ParseDateString("2000-01-01")
	endDate := ParseDateString("2018-10-28")

	resultsByConfiguration := make(map[string]*EvaluationResults, 0)

	db := GetHandle()

	tickers := GetAllCompanyTickers(db)
	dates := make([]string, 0)

	fmt.Print(tickers)

	companies := make(map[string]*Company, 0)
	for _, ticker := range tickers {
		company := GetCompanyByTicker(db, ticker)
		companies[ticker] = company
	}


	for splitDate.Before(endDate) {
		dates = append(dates, TimeToString(splitDate))
		splitDate = AddDays(splitDate, 7)

		trainingDocuments := make(map[string]string, 0)
		evaluationDocuments := make(map[string]string, 0)

		for _, ticker := range tickers {
			quotes := GetAllQuotesForTicker(db, ticker)
			gradeString, trainingString := getSplitGradeString(quotes, splitDate)
			trainingDocuments[ticker] = trainingString
			evaluationDocuments[ticker] = gradeString
		}

		ngramModel := CreateNGramModel(GradeQuoteClassifier, "", maxN)
		key := TimeToString(splitDate)
		evaluationResults := EvaluationResults{}
		evaluationResults.init()
		resultsByConfiguration[key] = &evaluationResults

		for ticker, document := range trainingDocuments {
			ngramModel.AddCase(companies[ticker], document)
		}

		for ticker, document := range evaluationDocuments {
			company := companies[ticker]
			trainingDocument := trainingDocuments[ticker]
			trainingEnd := len(trainingDocument)
			nextChar := trainingEnd + 1
			pred, _ := ngramModel.PredictNext(company, trainingDocument)
			actual := document[trainingEnd:nextChar]
			evaluationResults.AddCase(actual, pred)
		}
	}
}
You can run the experiment with:
./stockAnalysis -evaluate-ngram-model-over-time
The below graph shows the results:
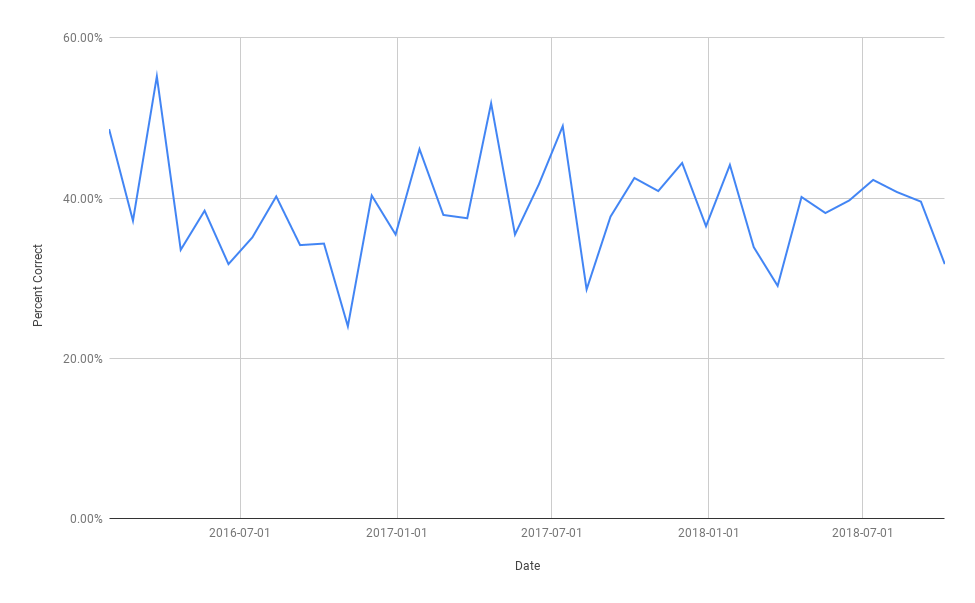
The accuracy of the predictions (the percent which were correct) varied between 22% and 55%, which is not very good!
Building a Pipeline
The model doesn't work that well, but it's still interesting to think about how to turn it into a weekly pipeline that automatically suggests stocks to buy! There's 4 things that need to be done each week:- Update company data
- Download new stock prices for every company
- Train an ngram model for the new data
- Make predictions for each stock
- Buy and sell based on predictions
Some companies may have been unlisted, and some new companies may have also been listed. Because of this we need to update the companies data. As mentioned before, the program can do this with:
./stockAnalysis -download-companies
We also need to download all the prices for the stocks for the last week. The program can add the missing data with:
./stockAnalysis -download-quotes
To train the model and make predictions, the program can output predictions with:
./stockAnalysis -predict > predictions.txt
All of these jobs could be run a on server, perhaps with a weekly cron job. Then, the user could check the predictions in "predictions.txt" each week and select which stocks to buy, sell and short.
With additional work, it would be possible (but probably a bad idea!) to automatically buy and sell stocks based on this.
Conclusion
My program can automatically download and analyze stock data. It also makes predictions, but they are not very good. It was certainly an interesting project. It is not surprising that it did not work well, since the model does is not based on much information. I think it is actually surprising how well it works.
One thing I learned is that Golang is not the best environment for experimenting with data. I've previously worked with Python, Pandas, and Jypter and that is a much nicer environment for messing around with data. Next time, I think it would be better to use those tools to get an idea about what kind of model would work first. Go does seem like a good platform for making a fast, production-ready data processing pipeline though! A possible downside is the lack of mature data-related libraries. This wasn't a problem for me because I wanted to try to do everything myself, as a learning experience.
There does seem to be some potential for this ngram-based approach, perhaps if combined with other models or ideas. Other ideas that would be interesting to consider include:- Different grading schemes (for example just UP and DOWN, or using more possible grades)
- Different time slices (days or months, instead of weeks)
- Correlating stock grades with each other, industry, or other factors
- Traditional trend following and moving averages
Return to Blog